期权市场一周纵览
来源:https://uqer.io/community/share/55027679f9f06c7a9ae9a53a
本文档依赖的数据 option_data.csv 可以通过运行 期权高频数据准备 notebook而获取。
from matplotlib import pylab
import pandas as pd
import seaborn as sns
sns.set(style="white", context="talk")

import pandas as pd
pd.options.display.float_format = '{:,>.4f}'.format
res = pd.read_csv('option_data.csv', parse_dates=['pdDateTime'])
res['timeStamp'] = res['dataDate'] + ' ' + res['dataTime']
res['timeStamp'] = pd.to_datetime(res['timeStamp'])
res.optionId = res.optionId.astype('str')
res = res.drop('Unnamed: 0', axis=1)
res.pdDateTime = res.pdDateTime.apply(lambda x:Date(x.year,x.month,x.day))
print('开始日期: ' + res['dataDate'].iloc[0])
print('结束日期: ' + res['dataDate'].iloc[-1])
print('Market Sample: ')
res[['dataDate', 'dataTime', 'optionId', 'lastPrice', 'bidPrice1', 'askPrice1', 'lastPrice(vol)']].head()

开始日期: 2015-03-05
结束日期: 2015-03-09
Market Sample:
| dataDate | dataTime | optionId | lastPrice | bidPrice1 | askPrice1 | lastPrice(vol) | |
|---|---|---|---|---|---|---|---|
| 0 | 2015-03-05 | 09:30:00 | 10000001 | 0.1677 | 0.1717 | 0.1765 | 0.3468 |
| 1 | 2015-03-05 | 09:30:14 | 10000001 | 0.1717 | 0.1717 | 0.1765 | 0.3768 |
| 2 | 2015-03-05 | 09:30:15 | 10000001 | 0.1717 | 0.1610 | 0.1798 | 0.3768 |
| 3 | 2015-03-05 | 09:30:16 | 10000001 | 0.1678 | 0.1610 | 0.1798 | 0.3525 |
| 4 | 2015-03-05 | 09:30:18 | 10000001 | 0.1798 | 0.1641 | 0.1798 | 0.4205 |
1. 买卖价差分析
1.1 买卖价差(到期时间)
bidAskSample = res[[u'optionId', 'pdDateTime', 'dataDate', 'contractType', 'strikePrice', 'bidAskSpread(bps)']]
bidAskSample.columns = ['optionId', 'maturity', 'tradingDate', 'contractType', 'strikePrice', 'bidAskSpread(bps)']

tmp = bidAskSample.groupby(['maturity'])[['bidAskSpread(bps)']]
ax = tmp.mean().plot(kind = 'bar', figsize = (12,6), rot = 45)
ax.set_title(u'买卖价差(按照期权到期时间)', fontproperties = font, fontsize = 25)
ax.set_xlabel(u'到期时间', fontproperties = font, fontsize = 15)

<matplotlib.text.Text at 0x7798290>

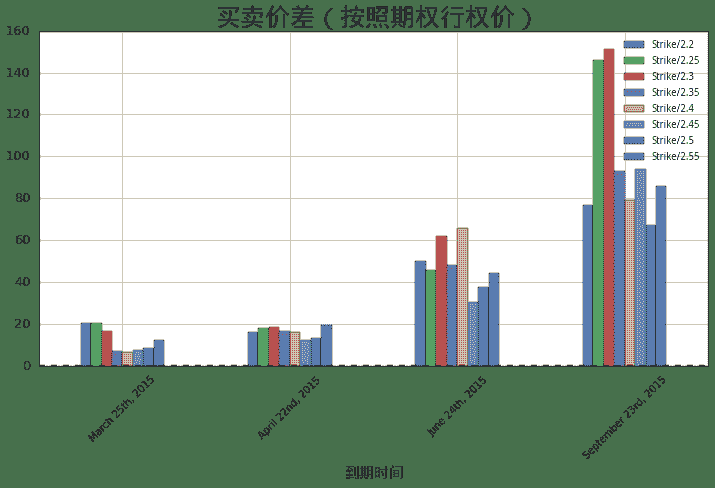
1.2 买卖价差(行权价)
tmp = bidAskSample.groupby(['maturity', 'strikePrice'])[['bidAskSpread(bps)']].mean().unstack()
ax = tmp.plot(kind = 'bar', figsize = (12,6), legend = True, rot = 45)
patches, labels = ax.get_legend_handles_labels()
labels = ['Strike/' + l.strip('()').split()[1] for l in labels]
ax.legend(patches, labels, loc='best', prop = font)
ax.set_title(u'买卖价差(按照期权行权价)', fontproperties = font, fontsize = 25)
ax.set_xlabel(u'到期时间', fontproperties = font, fontsize = 15)

<matplotlib.text.Text at 0x5bc08d0>
1.3 买卖价差(期权类型)
tmp = bidAskSample.groupby(['maturity', 'contractType'])[['bidAskSpread(bps)']].mean().unstack()
ax = tmp.plot(kind = 'bar', figsize = (12,6), rot = 45)
patches, labels = ax.get_legend_handles_labels()
labels = [l.strip('()').split()[1] for l in labels]
ax.legend(patches, labels, loc='best')
ax.set_title(u'买卖价差(按照期权类型)', fontproperties = font, fontsize = 25)
ax.set_xlabel(u'到期时间', fontproperties = font, fontsize = 15)

<matplotlib.text.Text at 0x7a8d7d0>

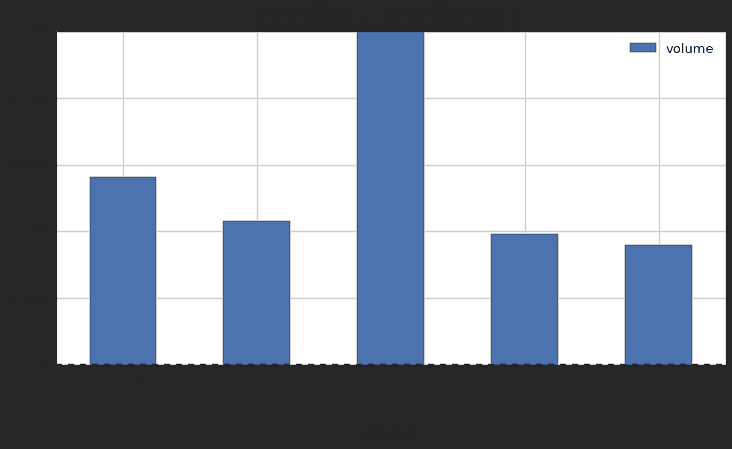
2. 日交易量分析
volumeSample = res[[u'optionId', 'pdDateTime', 'dataDate', 'contractType', 'strikePrice', 'volume']]
volumeSample.columns = ['optionId', 'maturity', 'tradingDate', 'contractType', 'strikePrice', 'volume']
tmp = volumeSample.groupby(['tradingDate'])[['volume']].sum()
ax = tmp.plot(kind = 'bar', figsize = (12,6), rot = 45)
ax.set_title(u'日交易量(按交易日期)', fontproperties = font, fontsize = 25)
ax.set_xlabel(u'交易日期', fontproperties = font, fontsize = 15)

<matplotlib.text.Text at 0x7a72d90>
2.1 日交易量(到期时间)
tmp = volumeSample.groupby(['maturity', 'tradingDate'])[['volume']].sum().unstack()
ax = tmp.plot(kind = 'bar', figsize = (12,6), rot = 45)
patches, labels = ax.get_legend_handles_labels()
labels = [l.strip('()').split()[1] for l in labels]
ax.legend(patches, labels, loc='best')
ax.set_title(u'日交易量(按照期权到期时间)', fontproperties = font, fontsize = 25)
ax.set_xlabel(u'到期时间', fontproperties = font, fontsize = 15)

每个交易日不同到期期限期权的交易量:
tmp
| volume | |
|---|---|
| tradingDate | 2015-03-05 |
| maturity | |
| March 25th, 2015 | 18767.0000 |
| April 22nd, 2015 | 7791.0000 |
| June 24th, 2015 | 965.0000 |
| September 23rd, 2015 | 635.0000 |
2.2 日交易量(行权价)
tmp = volumeSample.groupby(['tradingDate','strikePrice'])[['volume']].sum().unstack()
ax = tmp.plot(kind = 'bar', figsize = (16,8),  rot = 45)
patches, labels = ax.get_legend_handles_labels()
labels = ['Strike/' + l.strip('()').split()[1] for l in labels]
ax.legend(patches, labels, loc='best')
ax.set_title(u'日交易量(按照期权行权价)', fontproperties = font, fontsize = 25)
ax.set_xlabel(u'交易日期', fontproperties = font, fontsize = 15)

<matplotlib.text.Text at 0x7fa5610>
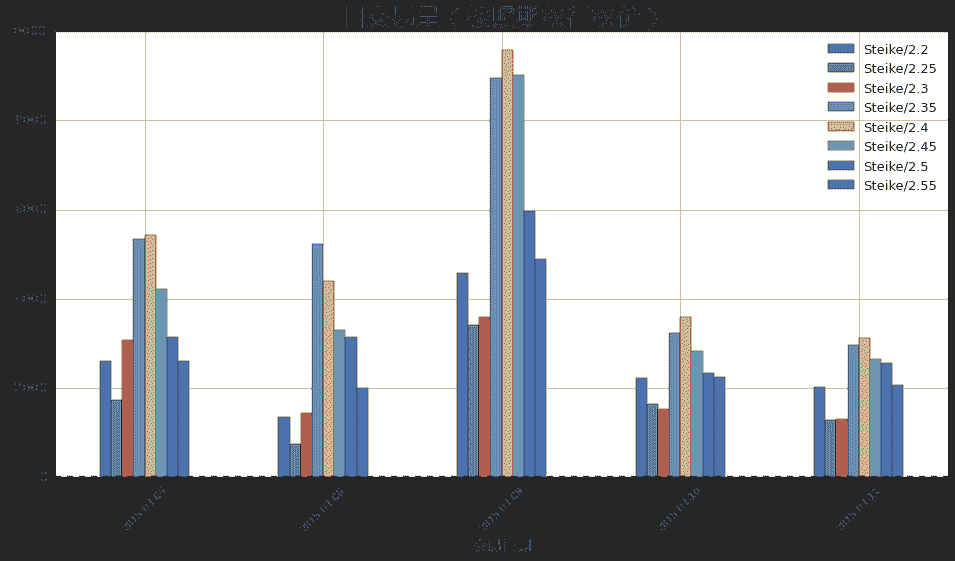
每个交易日不同行权价期权的交易量:
tmp
| volume | |
|---|---|
| strikePrice | 2.2000 |
| tradingDate | |
| 2015-03-05 | 2597.0000 |
| 2015-03-06 | 1352.0000 |
| 2015-03-09 | 4576.0000 |
| 2015-03-10 | 2225.0000 |
| 2015-03-11 | 2021.0000 |
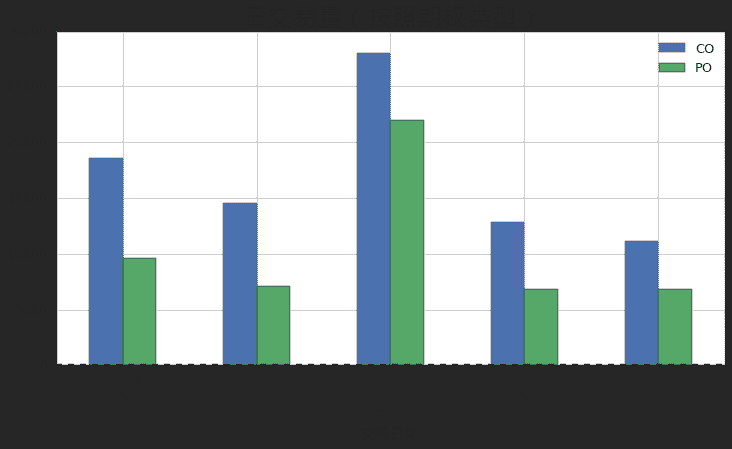
2.3 日交易量(期权类型)
tmp = volumeSample.groupby(['tradingDate','contractType'])[['volume']].sum().unstack()
ax = tmp.plot(kind = 'bar', y = ['volume'],  figsize = (12,6), rot = 45)
patches, labels = ax.get_legend_handles_labels()
labels = [l.strip('()').split()[1] for l in labels]
ax.legend(patches, labels, loc='best')
ax.set_title(u'日交易量(按照期权类型)', fontproperties = font, fontsize = 25)
ax.set_xlabel(u'交易日期', fontproperties = font, fontsize = 15)

<matplotlib.text.Text at 0x8813e10>
3. 波动率价差分析
bidAskVolSample = res[[u'optionId', 'pdDateTime', 'dataDate', 'contractType', 'strikePrice', 'bidAskSpread(vol bps)']]
bidAskVolSample.columns = ['optionId', 'maturity', 'tradingDate', 'contractType', 'strikePrice', 'bidAskSpread(vol bps)']
3.1 波动率价差(到期时间)
tmp = bidAskVolSample.groupby(['maturity'])[['bidAskSpread(vol bps)']]
ax = tmp.mean().plot(kind = 'bar', figsize = (12,6), rot = 45)
ax.set_title(u'波动率价差(按照期权到期时间)', fontproperties = font, fontsize = 25)
ax.set_xlabel(u'到期时间', fontproperties = font, fontsize = 15)

<matplotlib.text.Text at 0x8c0b7d0>

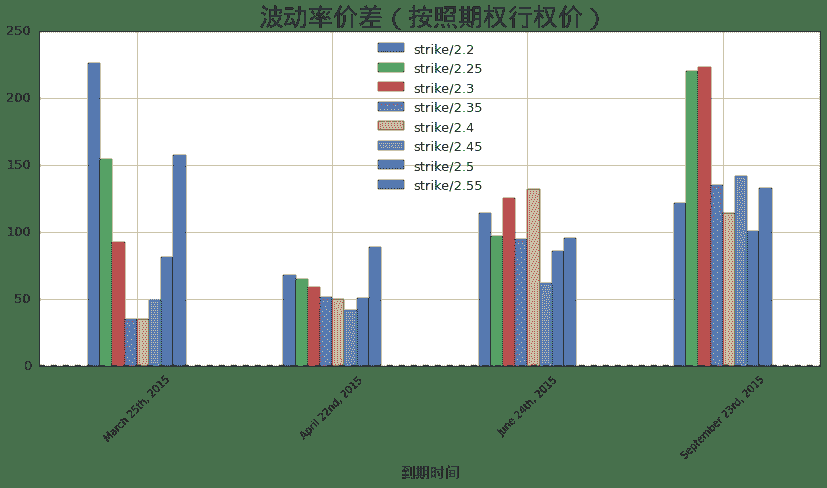
3.2 波动率价差(行权价)
tmp = bidAskVolSample.groupby(['maturity', 'strikePrice'])[['bidAskSpread(vol bps)']].mean().unstack()
ax = tmp.plot(kind = 'bar', figsize = (14,6), legend = True, rot = 45)
patches, labels = ax.get_legend_handles_labels()
labels = ['strike/' + l.strip('()').split()[-1] for l in labels]
ax.legend(patches, labels, loc='best')
ax.set_title(u'波动率价差(按照期权行权价)', fontproperties = font, fontsize = 25)
ax.set_xlabel(u'到期时间', fontproperties = font, fontsize = 15)
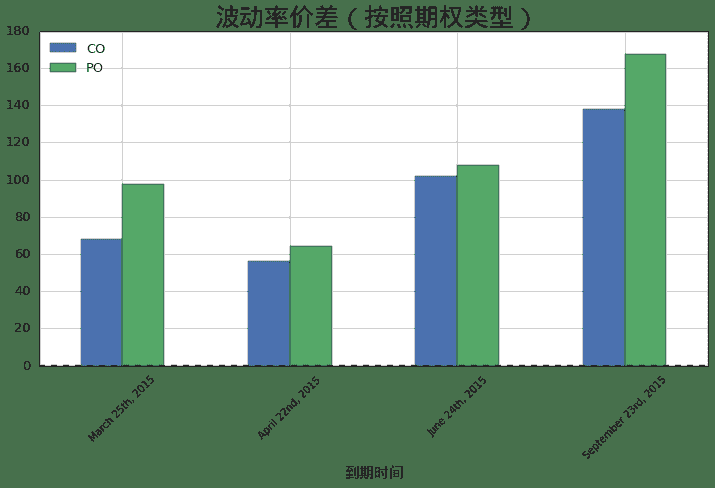
3.3 波动率价差(期权类型)
tmp = bidAskVolSample.groupby(['maturity', 'contractType'])[['bidAskSpread(vol bps)']].mean().unstack()
ax = tmp.plot(kind = 'bar', figsize = (12,6), rot = 45)
patches, labels = ax.get_legend_handles_labels()
labels = [l.split()[-1].strip('()') for l in labels]
ax.legend(patches, labels, loc='best')
ax.set_title(u'波动率价差(按照期权类型)', fontproperties = font, fontsize = 25)
ax.set_xlabel(u'到期时间', fontproperties = font, fontsize = 15)
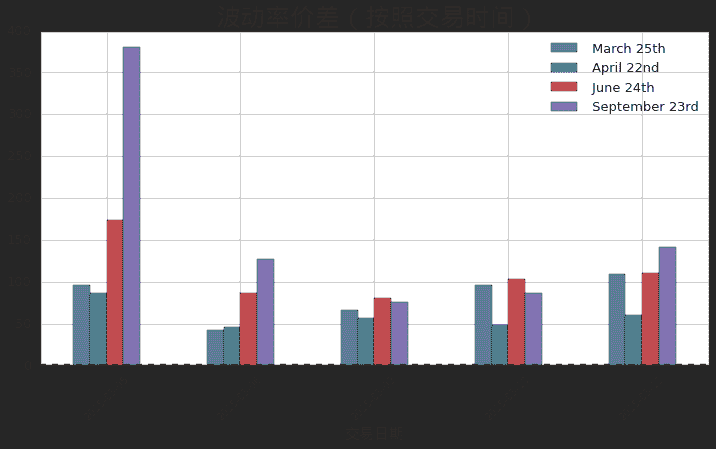
3.4 波动率价差(交易时间)
tmp = bidAskVolSample.groupby(['tradingDate', 'maturity'])[['bidAskSpread(vol bps)']].mean().unstack()
ax = tmp.plot(kind = 'bar', figsize = (12,6), rot = 45)
patches, labels = ax.get_legend_handles_labels()
labels = [l.split(',')[1].strip('()') for l in labels]
ax.legend(patches, labels, loc='best')
ax.set_title(u'波动率价差(按照交易时间)', fontproperties = font, fontsize = 25)
ax.set_xlabel(u'交易日期', fontproperties = font, fontsize = 15)

<matplotlib.text.Text at 0x8d1fc50>
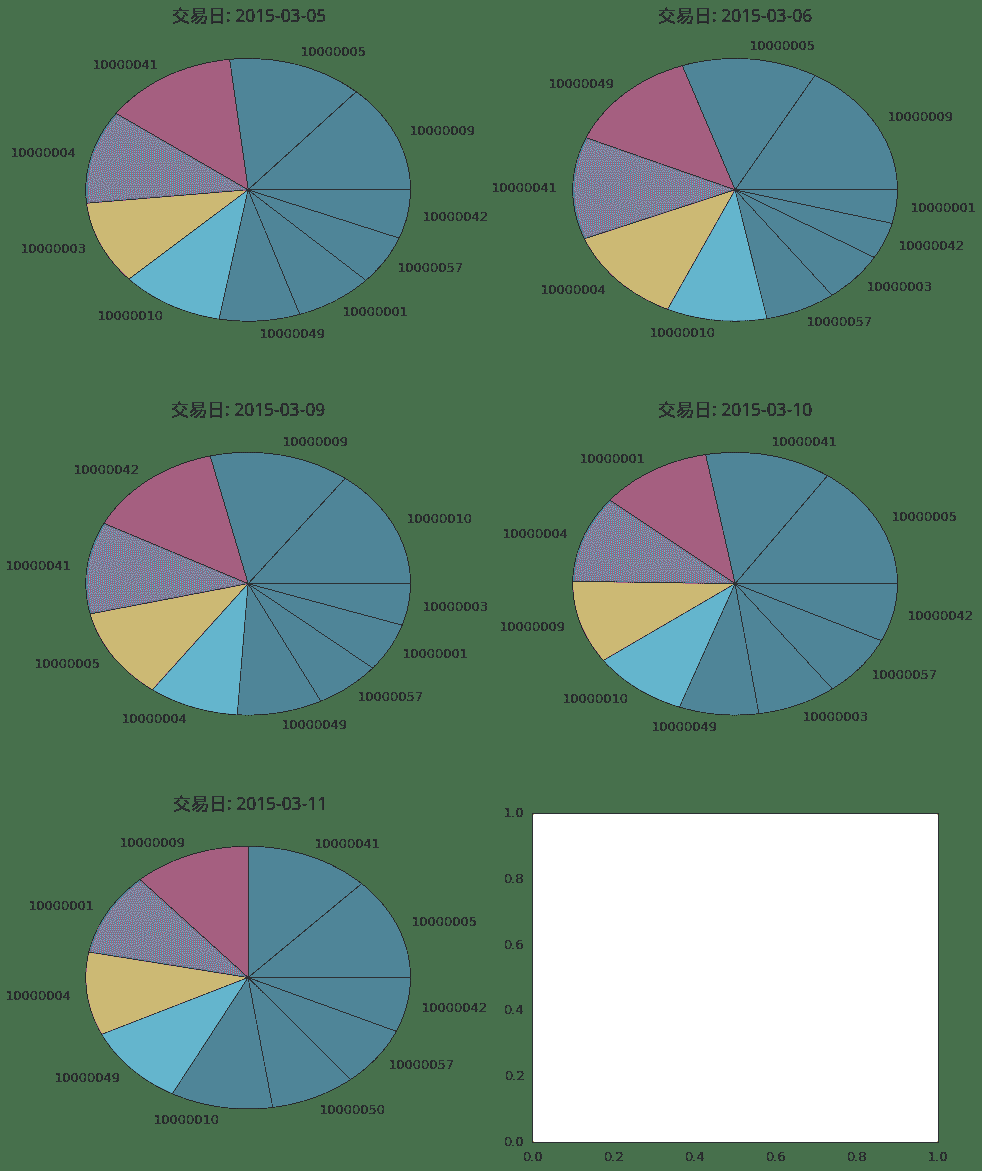
4. 个券分析
4.1 交易量
tmp = volumeSample.groupby(['tradingDate','optionId'])[['volume']].sum().unstack()
fig, axs = pylab.subplots(len(tmp)/2 + len(tmp)%2, 2, figsize = (16,8 * len(tmp)/2))
for i in range(len(tmp)):
    sample = pd.DataFrame(tmp.iloc[i]['volume'])
    sample.columns = ['volume']
    sample = sample.sort('volume', ascending = False)
    sample = sample[:10]
    row = i / 2
    col = i % 2
    sample.plot(kind = 'PIE',y = 'volume', sharex= False, ax = axs[row][col], legend = False, rot = 45)
    axs[row][col].set_title(u'交易日: ' + str(tmp.index[i]), fontproperties = font, fontsize = 18)
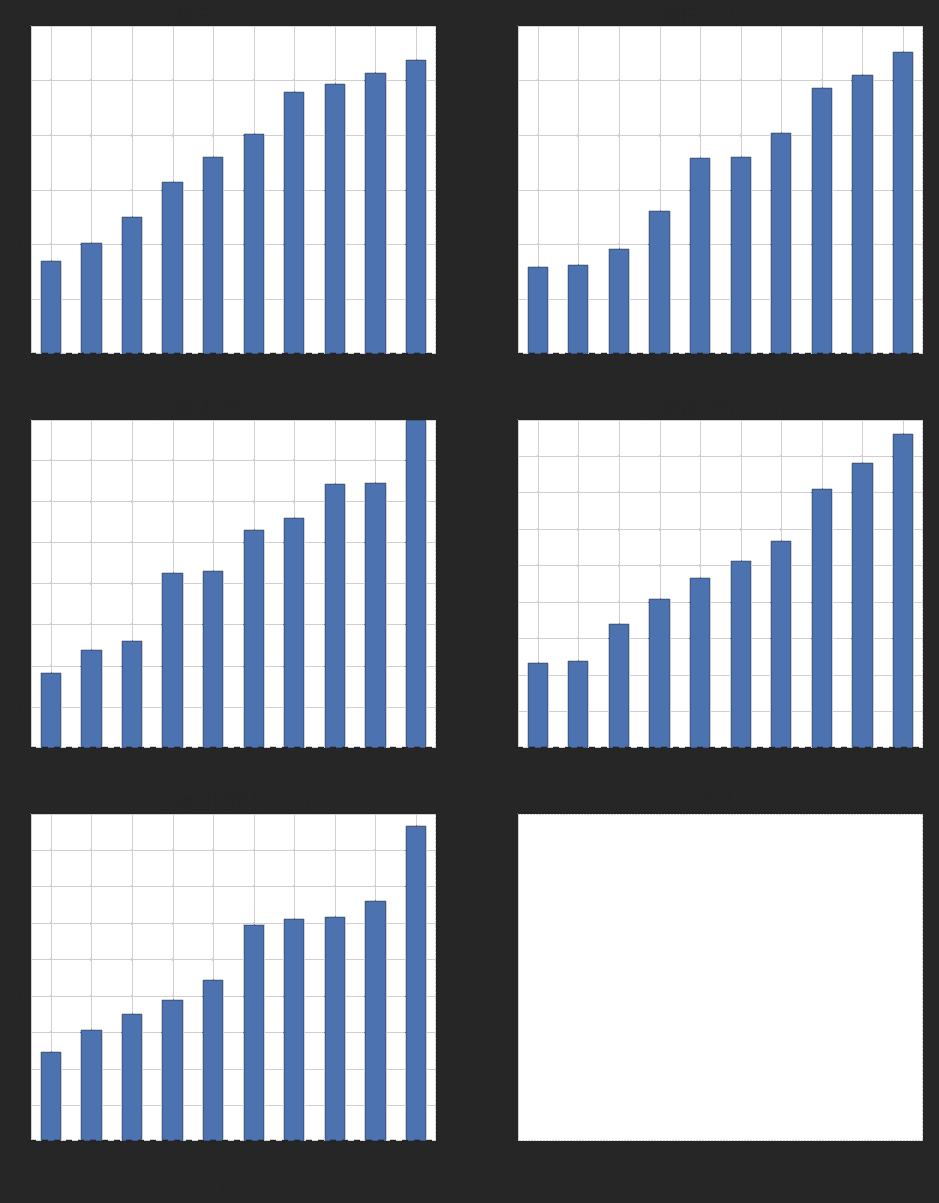
4.2 买卖价差
tmp = bidAskSample.groupby(['tradingDate','optionId'])[['bidAskSpread(bps)']].mean().unstack()
fig, axs = pylab.subplots(len(tmp)/2 + len(tmp)%2, 2, figsize = (16,8*len(tmp)/2))
for i in range(len(tmp)):
    sample = pd.DataFrame(tmp.iloc[i]['bidAskSpread(bps)'])
    sample.columns = ['bidAskSpread(bps)']
    sample = sample.sort('bidAskSpread(bps)')
    sample = sample[:10]
    row = i / 2
    col = i % 2
    sample.plot(kind = 'bar',y = 'bidAskSpread(bps)', sharex= False, ax = axs[row][col], legend = False, rot = 20)
    axs[row][col].set_title(u'交易日: ' + str(tmp.index[i]), fontproperties = font, fontsize = 18)
4.3 波动率价差
tmp = bidAskVolSample.groupby(['tradingDate','optionId'])[['bidAskSpread(vol bps)']].mean().unstack()
fig, axs = pylab.subplots(len(tmp)/2 + len(tmp)%2, 2, figsize = (16,8*len(tmp)/2))
for i in range(len(tmp)):
    sample = pd.DataFrame(tmp.iloc[i]['bidAskSpread(vol bps)'])
    sample.columns = ['bidAskSpread(vol bps)']
    sample = sample.sort('bidAskSpread(vol bps)')
    sample = sample[:10]
    row = i / 2
    col = i % 2
    sample.plot(kind = 'bar',y = 'bidAskSpread(vol bps)', sharex= False, ax = axs[row][col], legend = False, rot = 20)
    axs[row][col].set_title(u'交易日: ' + str(tmp.index[i]), fontproperties = font, fontsize = 18)

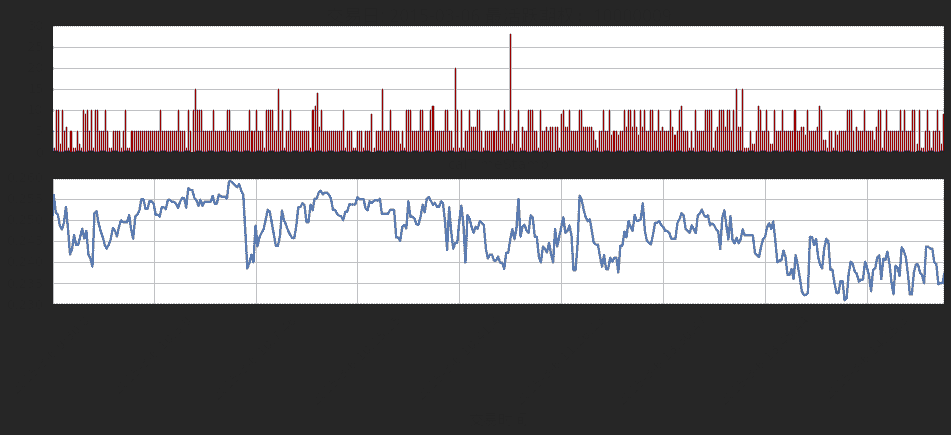
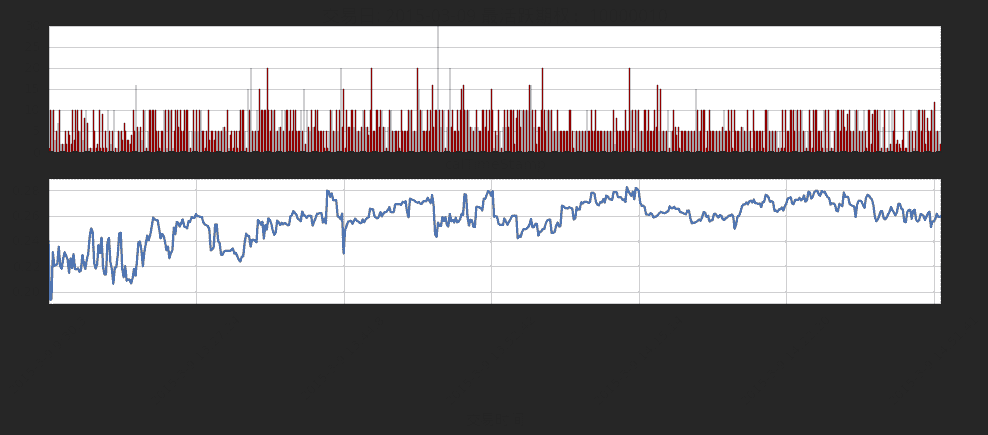
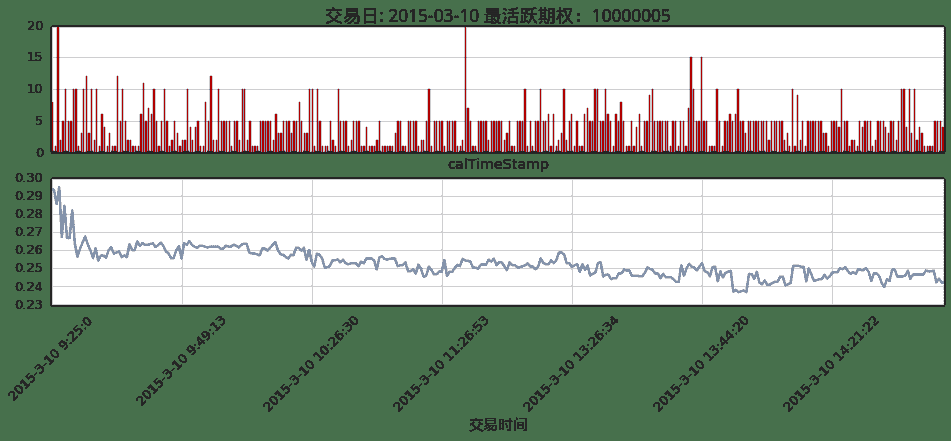
4.4 时间序列分析
tmp = volumeSample.groupby(['tradingDate','optionId'])[['volume']].sum().unstack()

for i, d in enumerate(tmp.index):
    fig, axs = pylab.subplots(2, 1, figsize = (16,5))
    sample = tmp.loc(d)
    sample = sample[d]
    sample.sort('volume', ascending = False)

    base = res[res['dataDate'] == d]
    base = base[base.optionId == sample.index[0][1]]
    base.index = range(len(base))

    base['calTimeStamp'] = base.timeStamp.apply(lambda s: DateTime(s.year, s.month, s.day, s.hour, s.minute, s.second))
    ax = base.plot(x = 'calTimeStamp', y = ['volume'], kind = 'bar', sharex=True, xticks = [], color = 'r', ax = axs[0])
    ax.set_title(u'交易日: ' + unicode(d) + u' 最活跃期权:'+ unicode(sample.index[0][1]), fontproperties = font, fontsize = 18)
    ax = base.plot(x= 'calTimeStamp', y = ['lastPrice(vol)'], sharex=True, legend = True,ax = axs[1], rot = 45)
    ax.set_xlabel(u'交易时间', fontproperties = font, fontsize = 15)